

Demystifying the P-Value: A Crucial Concept in Data Science Often Misunderstood
As data scientists, we’ve all encountered it: the abrupt question mid-conversation, "What exactly does a p-value mean?" The initial response, often fumbled and evolving over time, highlights a widespread challenge. This fundamental concept, crucial across numerous scientific and analytical fields, is frequently explained in ways that obscure its true meaning, leading to widespread misinterpretation. The goal of this article is to provide a clear, accurate, and contextualized understanding of p-values, moving beyond common misconceptions and illustrating their critical role in discerning signal from noise in data.
The Pervasive Misconceptions Surrounding P-Values
Many professionals who regularly utilize p-values in their work struggle to articulate a precise definition. Common explanations often gravitate towards flawed interpretations such as: "There’s a 5% chance my result is due to randomness," or "There’s a 95% chance my hypothesis is correct." Perhaps the most prevalent, yet fundamentally incorrect, notion is that "a lower p-value equals more true or better results." These interpretations are not just slightly off; they represent a core misunderstanding of what a p-value actually measures. The root of this confusion lies in how statistical concepts are typically taught and how readily our human intuition seeks to infer causality rather than assess probability under specific assumptions.
The fundamental issue is that we are often asking the wrong question when interpreting p-values. Instead of seeking to understand the probability of our hypothesis being true given the data, we should be focusing on the probability of observing our data (or more extreme data) if a specific null hypothesis were true. This subtle but critical distinction is the key to unlocking the true meaning of a p-value.
A More Accurate Framework: The "Surprise" Metric
At its core, a p-value is a measure of how surprising your observed data would be if there were actually no real effect or relationship present. In simpler terms, it quantifies the likelihood of observing results as extreme as, or more extreme than, what you have gathered, assuming that only random chance is at play.
Imagine a spectrum of possible outcomes. When no underlying phenomenon is occurring, results typically cluster around a central point representing "no difference" or "no effect." However, randomness, by its nature, can occasionally produce extreme outcomes. When your observed result falls far into the tails of this distribution, the p-value addresses the question: "How often would I expect to see a result this extreme, or even more extreme, purely by chance?"
Illustrative Case Study: The Bakery’s New Cookie
To grasp this concept concretely, consider a scenario familiar to many businesses. A bakery owner has developed a new cookie recipe and suspects it’s superior to the existing one. To validate this, a simple test is devised:

- The Experiment: Two groups of customers are randomly selected. One group tastes the original cookie, and the other tastes the new recipe. Each customer provides a rating on a scale.
- The Observation: After collecting the ratings, the average rating for the new cookie is found to be 8% higher than that of the original cookie.
The immediate question arises: Is the new cookie genuinely better, or did the owner simply get a more favorable group of tasters by chance? This is precisely where the p-value comes into play, offering a probabilistic answer.
Step 1: Formulating the Null Hypothesis
The starting point in statistical hypothesis testing is to assume the opposite of what you are trying to prove. This is known as the null hypothesis (H₀). In the bakery example, the null hypothesis would be: "There is no real difference in customer preference between the original and the new cookie recipes." This posits that any observed difference in ratings is merely a result of random variation in customer tastes.
Step 2: Simulating a "Random World"
Instead of relying solely on complex mathematical formulas, we can conceptualize the p-value by simulating a "random world" based on the null hypothesis. Imagine repeatedly conducting this customer tasting experiment thousands of times. If the null hypothesis is true (i.e., the cookies are indeed identical in appeal), then in these simulations, sometimes the "new" cookie group would randomly receive higher ratings, and sometimes the "original" cookie group would. This is the inherent variability of chance.
The simulation process involves:
- Assuming the null hypothesis is true (both cookies are equally liked).
- Generating a large number of simulated experiments under this assumption.
- For each simulation, calculating the difference in average ratings between the two hypothetical groups.
- Finally, determining how often a difference of 8% or greater (the observed difference) occurs in these simulations.
This simulation-driven approach allows us to intuitively understand the probability of observing our data under the null hypothesis. If, for instance, the simulation shows that a difference of 8% or more occurs in 20% of the random trials, then the p-value is 0.20.
Interpreting the P-value in the Bakery Example
A p-value of 0.20 signifies that if the new cookie recipe were no better than the old one, we would expect to see a difference in customer ratings as large as 8% (or larger) approximately 20% of the time, simply due to random chance. This suggests that the observed 8% improvement is not particularly "weird" or surprising if the null hypothesis is true. Therefore, we have less evidence to reject the idea that the cookies are equally good.
The article’s visual representation of this concept (referencing an image that would depict the distribution of simulated differences) is key. It would show that the observed difference of 8% falls within a region that occurs relatively frequently due to random fluctuations. Conversely, if the p-value were very low (e.g., 0.01), it would indicate that observing such a large difference would be highly unlikely if the null hypothesis were true, thus providing stronger evidence to reject the null hypothesis in favor of the alternative (that the new cookie is indeed better).

The Crucial Distinction: What P-values Don’t Tell You
The most common pitfall in understanding p-values is confusing what they measure with what we want them to measure. The p-value answers the question:
"If the null hypothesis is true, how likely is this data?"
However, our intuition often leads us to ask:
"Given this data, how likely is my hypothesis true?"
This is analogous to the difference between asking, "If it’s raining, how likely is it that the streets are wet?" versus "If the streets are wet, how likely is it that it’s raining?" While related, these are distinct probabilistic statements. Our minds naturally work in reverse, seeking to infer truth from observed evidence. P-values, by design, operate in the opposite direction: they assume a world (the null hypothesis) and evaluate the unusualness of the data within that world.
Therefore, a p-value of 0.03 does not mean there’s a 3% chance the null hypothesis is true or that you are 3% wrong. It means that if the null hypothesis were indeed true, observing data as extreme as yours would occur only 3% of the time. This absence of "truth" or "correctness" in the p-value’s definition is precisely why it can be so counterintuitive.
Why Misinterpreting P-values Matters: Real-World Implications
The repercussions of misunderstanding p-values are far-reaching and can lead to flawed decision-making across various domains:
- Overstating Significance: A common error is equating a statistically significant result (typically p < 0.05) with absolute proof of a hypothesis. This overlooks the fact that even with a low p-value, there remains a non-zero probability that the observed effect is due to chance. This can lead to premature conclusions and investments in ineffective strategies.
- The "P-Hacking" Problem: When researchers or analysts conduct numerous tests or manipulate data until a desired low p-value is achieved, it’s known as p-hacking. This inflates the chances of finding a statistically significant result purely by chance, leading to spurious findings that cannot be replicated. For example, a pharmaceutical company might test a new drug against dozens of potential health markers. If any of these tests yield a p-value below 0.05, it might be reported as a breakthrough, even if the drug has no real therapeutic effect on the primary target.
- Ignoring Practical Significance: A result can be statistically significant but practically meaningless. For instance, a marketing campaign might show a statistically significant 0.1% increase in customer engagement with a p-value of less than 0.01. While technically "significant," this minuscule improvement might not justify the cost and effort of the campaign, rendering it practically useless.
The P-value as a "Weirdness Score"

A more helpful analogy is to think of a p-value as a "weirdness score." A high p-value indicates that the observed data is not particularly unusual under the assumption of randomness. A low p-value, conversely, suggests that the data is quite strange if only chance is at play. This "weirdness" prompts us to question our initial assumption (the null hypothesis) and consider that there might be a genuine underlying effect at work. Hypothesis testing, at its heart, is a formal process of questioning assumptions based on observed data.
The Arbitrary Nature of the 0.05 Threshold
The ubiquitous "p < 0.05" rule is a convention, not a scientific law. This threshold gained prominence through the work of statistician Ronald Fisher, who suggested 5% as a reasonable level of rarity to warrant questioning the null hypothesis. It was a practical choice, aiming to strike a balance between two types of errors:
- Type I Error (False Positive): Rejecting the null hypothesis when it is actually true. A stricter threshold (e.g., p < 0.01) reduces this risk.
- Type II Error (False Negative): Failing to reject the null hypothesis when it is false. A looser threshold (e.g., p < 0.10) reduces this risk.
The 0.05 threshold was chosen as a middle ground. A p-value of 0.05 means that if nothing were happening, observing a result as extreme as yours would occur less than 5% of the time. It’s a pragmatic decision, but it’s crucial to remember that it is a convention and not an absolute determinant of truth.
The Takeaway: Shifting the Perspective
The most critical takeaway from understanding p-values is to shift away from asking, "Is my hypothesis true?" or "What is the probability I am wrong?" Instead, embrace the question: "How surprising is this result if nothing real were happening?"
P-values should not be viewed as a binary switch indicating absolute truth or falsehood. They represent a gradient of evidence. A p-value exists on a spectrum:
- Very Low P-values (e.g., < 0.001): Indicate that the observed data is highly unlikely to have occurred by chance alone under the null hypothesis. This provides strong evidence against the null hypothesis.
- Moderately Low P-values (e.g., 0.01 to 0.05): Suggest that the data is somewhat unlikely under the null hypothesis, providing moderate evidence against it.
- Higher P-values (e.g., > 0.05): Indicate that the observed data is not particularly unusual under the null hypothesis, providing weak evidence against it.
By reframing our thinking from a rigid binary decision to a nuanced evaluation of evidence, we can begin to interpret p-values more accurately. This leads to more robust data analysis, better-informed decisions, and a clearer understanding of the distinction between genuine effects and the vagaries of chance. The journey to fully grasp p-values is a common one in data science, but the reward is a more profound and reliable approach to interpreting the world through data.


Related Posts

Unlocking Engineering Efficiency: A Deep Dive into Anthropic’s Claude Cowork for Enhanced Productivity
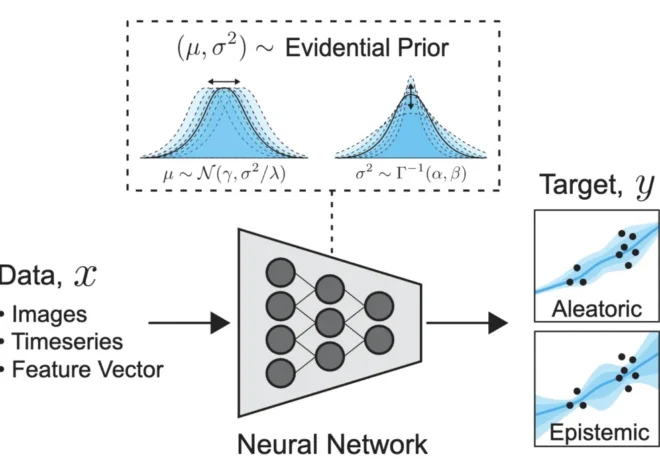
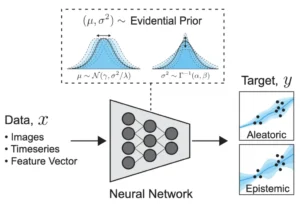
Uncertainty Quantification in Machine Learning: A Deep Dive into Evidential Deep Learning and Deep Evidential Regression

