

Mastering Google Search Console Metrics A Deep Dive Into Average Position and Organic Search Performance
The digital marketing landscape has undergone a seismic shift over the last decade, transitioning from a focus on simple keyword density to a complex ecosystem of user intent, artificial intelligence, and multi-faceted search results. At the heart of this evolution is Google Search Console, a platform widely regarded by industry experts as the most definitive source for evaluating a website’s organic visibility. Despite its critical importance, the data provided within the platform’s Performance reports often remains a source of significant confusion for corporate executives and stakeholders who lack deep technical optimization expertise.
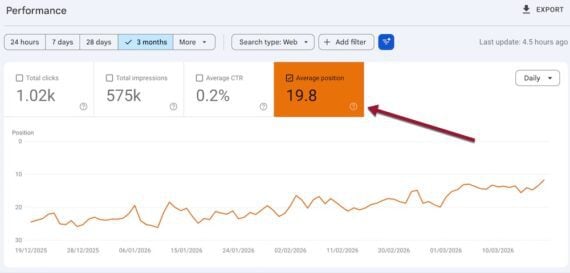
One of the most frequently misunderstood metrics is the "Average Position." While it appears as a straightforward numerical value at the top of performance dashboards, its implications are often misinterpreted by business leaders who equate a lower average with failing performance. To accurately gauge the health of a digital property, one must understand the nuance behind how Google aggregates this data and how modern search features—ranging from AI Overviews to Image Packs—influence the final tally.
The Mechanics of the Overall Average Metric
The "Average Position" metric is an aggregated figure representing a website’s standing across every search query for which it has appeared in a user’s results. To the uninitiated, a high number, such as an average position of 25, might signal a lack of relevance. However, because Google typically displays 10 organic listings per page, an average of 25 merely indicates that, across the vast spectrum of the internet, the site tends to appear on the third page of results.

The theoretical "best" ranking is 1, while Google rarely reports data beyond position 100. The primary reason digital marketing consultants often advise executives to de-emphasize the "Overall Average" is its tendency to be skewed by "long-tail" keywords. If a website begins to rank for thousands of new, niche queries on page five or six, the overall average position will technically drop (the number will increase), even if the site is simultaneously maintaining the number one spot for its most profitable core keywords. This statistical dilution makes the overall average a poor Key Performance Indicator (KPI) for business success when viewed in isolation.
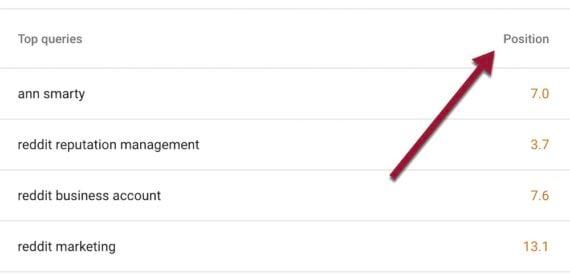
Granular Analysis: The Query-Specific Average
To find actionable intelligence, analysts must move past the dashboard summary and look at the "Query Average." This section of the Performance report breaks down the average position of a specific URL for a particular search term. This calculation is a mean average of every instance where a URL appeared for a searcher. For example, if User A sees a website at position 1 and User B sees it at position 2, Search Console will report an average position of 1.5.
A critical distinction in how this data is collected involves the "impression" threshold. Google Search Console only records an average query position if a searcher—or in some cases, an automated crawler—actually views the result. This means that if a site ranks at position 50 for a term but the user never scrolls past page one, that "position 50" may not be factored into the data until a user actually reaches that depth in the results.
The Evolution of the SERP: Beyond the Ten Blue Links
The traditional concept of a search result—a simple list of ten blue links—is largely a relic of the past. Today, Google utilizes a variety of "special elements" that occupy space on the Search Engine Results Page (SERP). According to Google’s official documentation, each organic result counts as one position, but so do specialized features such as AI Overviews, Image Packs, and "People Also Ask" (PAA) boxes.
This creates a complex hierarchy for ranking. For instance, if a website ranks in the number one organic slot but an Image Pack appears at the very top of the page, the organic result is technically pushed to position 2. Conversely, if a website’s content is featured within an Image Pack or an AI-generated summary at the top of the page, all URLs cited within that specific feature are recorded as occupying position 1.
This leads to a phenomenon where a URL might have an average position of 1, yet not be the first "link" a user sees if they are looking for traditional organic results. The integration of AI Overviews has further complicated this, as a URL cited in the lower portion of an AI summary might still be attributed a top-tier position, despite being visually less prominent than a traditional link.
Chronology of Google’s Search Performance Reporting
The tools available to webmasters have evolved significantly since the early days of the internet. Understanding this timeline provides context for why certain metrics exist today:
- 2005: Google launches "Sitemaps," which eventually becomes Google Webmaster Tools. This was the first time site owners had a direct line of communication with the search engine.
- 2015: Google rebrands Webmaster Tools as "Google Search Console" to reflect a more inclusive user base that includes SEOs, designers, and app developers.
- 2018: The "New Search Console" is launched, introducing the Performance Report with 16 months of historical data, a significant increase from the previous 90-day limit. This report introduced the current iteration of the "Average Position" metric.
- 2021-2022: Google enhances the report to include more specific data on "Search Appearances," allowing users to filter by "Good Page Experience" and "Rich Results."
- 2023-2024: The introduction of Search Generative Experience (SGE) and AI Overviews begins to change how positions are calculated, with citations in AI summaries now factoring into the performance metrics.
The Role of Device and Geography in Data Variance
One of the most common reasons for discrepancies between what an executive sees on their screen and what Search Console reports is the variance in search results by device and location. Google frequently optimizes the order of results differently for mobile and desktop browsers. For example, Image Packs or local Map Packs might be prioritized on a mobile device to assist a user on the go, while desktop results might favor long-form informational articles.
By default, Search Console provides an aggregated view of this data. To obtain a clear picture, analysts must apply filters. By selecting "Add filter" > "Device" > "Mobile," a site owner can see how they rank specifically for smartphone users. Comparing mobile and desktop data often reveals that a site’s "Average Position" is healthy on one platform but lagging on another, usually due to technical issues like slow mobile load times or non-responsive design.
Supporting Data and Industry Reaction
Recent industry studies have highlighted the danger of over-reliance on position metrics. According to data from various SEO research firms, the first organic result on Google maintains an average click-through rate (CTR) of approximately 28% to 35%. However, this number drops precipitously to roughly 2% by the time a user reaches the tenth result.
Because of this "winner-take-most" dynamic, experts argue that a site’s "Average Position" is less important than its "Share of Voice" for high-intent keywords. Digital marketing agencies have reported a shift in client reporting, moving away from "Total Average Position" and toward "Position Distribution." This involves tracking how many keywords fall into the "Top 3," "Top 10," and "Top 100" buckets.
The reaction from the SEO community regarding Search Console’s reporting has been one of cautious appreciation. While professionals value the accuracy of the data—coming directly from Google—they often critique the platform for its "data latency" (usually a 2-to-3-day delay) and the lack of transparency in how AI Overview positions are weighted against traditional organic links.

Strategic Implications for Business Growth
For a business to leverage Search Console effectively, it must move toward a more sophisticated interpretation of "Average Position." The implications of this metric are twofold:
- Identifying Opportunities: If a query has an average position of 11 or 12, it means the site is sitting at the top of the second page. A minor optimization—such as improving the meta description or adding internal links—could push that result to page one, where the CTR is significantly higher.
- Diagnosing Volatility: A sudden spike in the "Average Position" (moving from 10 to 30) across all queries often indicates a broad algorithmic update or a technical site error, such as a broken "robots.txt" file or a failed site migration.
Ultimately, Google Search Console is a diagnostic tool, not a scoreboard. The "Average Position" is a temperature check of a site’s overall reach, but it does not tell the full story of revenue or user engagement. Executives are encouraged to view these numbers through the lens of specific business goals: ranking #1 for a brand name is mandatory, while an average position of 50 for a broad, informational term might be an acceptable starting point for a long-term content marketing strategy.
As Google continues to integrate more AI-driven features into its search results, the definition of a "position" will likely continue to shift. Success in this new era of search will require a move away from vanity metrics and toward a granular understanding of how various SERP elements—from organic links to AI citations—contribute to a brand’s digital footprint.
Related posts:


Related Posts

Global Ecommerce Evolution 2026: The Rise of Agentic Commerce, Circular Logistics, and Embedded Financial Systems
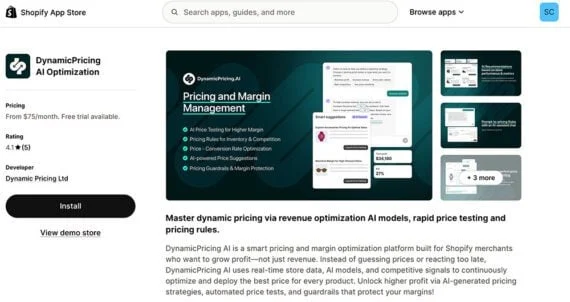
The Evolution of Ecommerce Pricing How AI is Transforming Static Labels into Dynamic Personalization for Global Retailers

